
So, right, where were we? Well, the last time I had a chance to blog, I was pointing out that it’s just wrong to blame US inflation on a collapse in supply. Sure, there were cases where Covid made it impossible for factories to operate properly, say because many of their workers were ill. But on the whole, production held up remarkably well during the pandemic.
Why then were there shortages of so many goods? Why is it that even now when you go to the store for basic items the clerks sometimes tell you that, no they don’t have what you want and no, they aren’t really sure when they’ll get any more?
There’s actually a simple answer to this question. A seriously simple answer.
If there is a shortage of a good, it means that demand exceeds the supply. So, if major shortages are suddenly materializing, that means either (1) aggregate supply has fallen sharply or (2) aggregate demand has soared. Since we already discarded the first possibility in the previous post, let’s now consider the second explanation.
Sure, the idea that the shortages were caused by too much demand sounds strange. But we do know it happens from time to time, right? For example, when there is a fad. One day, a few influencers say that everyone needs to own a pet rock and the next day there are shortages of rocks. Yes, rocks. (You think I’m kidding? I am not. It really happened, back in the 1970s.)
Ok, you say, but what does this have to do with the current situation? We are not talking about the demand for one or two trendy items. We are talking about aggregate demand, meaning total spending, for everything in the economy. And here there seems to be a logical problem. During the peak of the pandemic there were severe lockdowns and many people lost their jobs. So why, exactly would they have increased their spending?
Glad you asked, for this is an excellent question. To answer it, we need to look at the data. Here’s a chart showing what happened to the amount of money that people earned. You can see that it indeed plunged during the lockdowns and only regained its pre-pandemic levels in the spring of 2021. Looking at this chart, one would have thought that aggregate demand must have been depressed, not strong, during this period.
So, we must be missing something. What is it? Well, there’s a clue right there, in the title of the chart. If you look closely you see that it says “excluding transfers”. That means excluding payments from the government, like unemployment benefits and stimulus checks. And transfers positively soared during the pandemic. Just look at the chart below (this time, in nominal dollars).
How significant were these transfers? Very significant. At one point, payments from the government were making up more than a third of disposable income. That’s a huge percentage, so huge that I think I should repeat it: at one point, more than one-third of the money received by households was coming from the government.
These transfer payments were so large that they completely transformed households’ income position. Remember that chart which showed earned income plunging during the lockdowns? Now, take a look at the picture of total income, including transfers. See how the reduction has completely vanished? In fact, transfers not only made up for the loss of income during the pandemic, they actually exceeded these losses. Real disposable income actually increased during the pandemic.
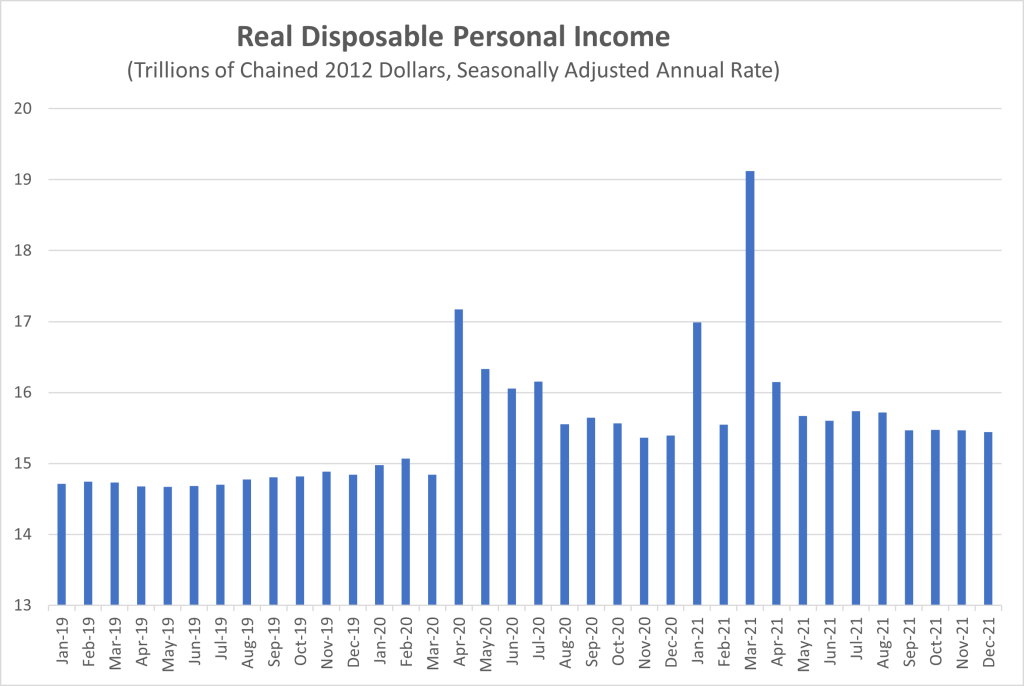
Take a moment to let that sink in. During peak pandemic, government transfers were so big that household incomes actually increased, even though people were earning far less than before. Amazing!
Now comes the second twist. Households had plenty of money to spend, but they couldn’t really spend it on services because, well, many of those services were locked down. So, they spent it on goods, especially goods that would come in handy when working from home, so-called “durable goods” such as computers or furniture. Some people bought more spacious houses; others expanded their existing ones, to make more room for all those students or workers who were suddenly staying at home all day. The result was one enormous boom in demand for goods. Take a look at this amazing chart. I’ve indexed it for you, so that you can see things clearly.

Yes, you read that correctly. As all those transfer payments kicked in, households increased their spending on goods by 25 percent!
Now, even in normal times, it would not be possible to increase supply by 25 percent in a matter of months. The US economy is simply not geared up to do this. After all, the economy only grows around 2 percent in a year. If it grows by 5 percent, this is considered to be a real boom. And of course this was not a normal time. This was during pandemic.
So, when demand started to soar, shortages suddenly materialized. Firms just couldn’t produce things fast enough to meet this demand and even if they could, they couldn’t ship them. After all, there were just so many ships, trucks, trains, and containers to go around.
There were also cases when factories had the capacity to produce and ship things, but they lacked critical components. For example, with all that demand for computers and internet-enabled home products, a severe shortage of semiconductors developed. As a result, car manufacturing suffered.

So, yes, the supply chains did break down. But it is important to be clear. This was not because there was some temporary problem with supply, which will gradually disappear as the pandemic ebbs. It was because there was a huge increase in the demand for goods.
And this is the key to understanding why inflation suddenly surged during the pandemic. You can see the mechanism in the following chart, which looks at durable goods, where the surge was particularly pronounced. As demand soared, prices suddenly took off, with inflation for these products reaching 17 percent by the end of 2021.

Looking ahead, then, the question is not when supply will go back to normal. It is whether demand is going to go back to normal. And that will be the subject of our next blogpost.
Stay tuned.
