Last week, the US reported that growth reached 6.5 percent in the June quarter (seasonally adjusted, annual rate), following the 6.3 percent rate recorded in the previous quarter. These are exceptionally strong numbers.
Sure, they follow a recession. But the economy doesn’t always roar back after a setback, the way it is doing now. When the economy was coming out of the previous recession in 2009, the best that it could manage was one quarter of 4.3 percent growth. The rebound after the 2000 recession was similarly tepid. In fact, to find such strong growth rates, one would need to go back to the early 1980s.
Clearly, then, such strong numbers mean that the economy must be firing on all cylinders. Right? Ummm…not exactly. In fact, this is the strangest GDP report I’ve ever seen. Here’s a graph showing the contributions to growth from the various components of expenditure.
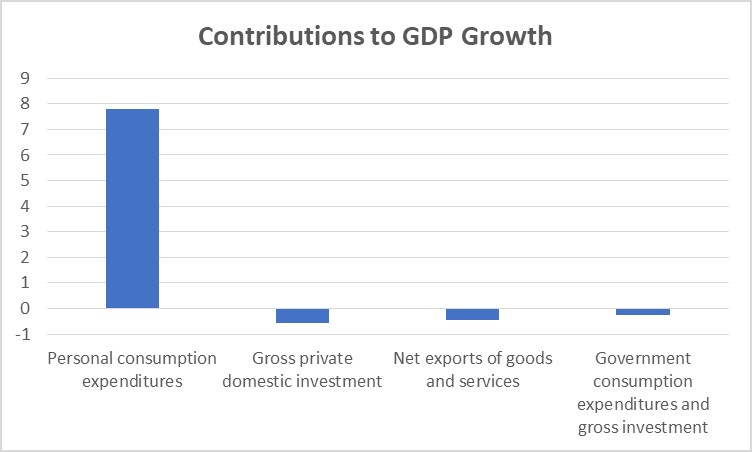
See the problem? The only – and I mean the only — category that boosted growth was consumption. Every other category shrank: investment, net exports, even government. What could possibly explain this seriously unbalanced growth?
The broad answer is…supply shortages. The graph above epitomizes what happens when an economy tries to expand even as it faces severe supply shortages.
At this point you might be wondering what exactly is causing these shortages. I hear you, but I need to keep this blogpost to a manageable length. I don’t have that much time to write, and you don’t have much time to read. So I’ll be brief here, and expand in subsequent posts.
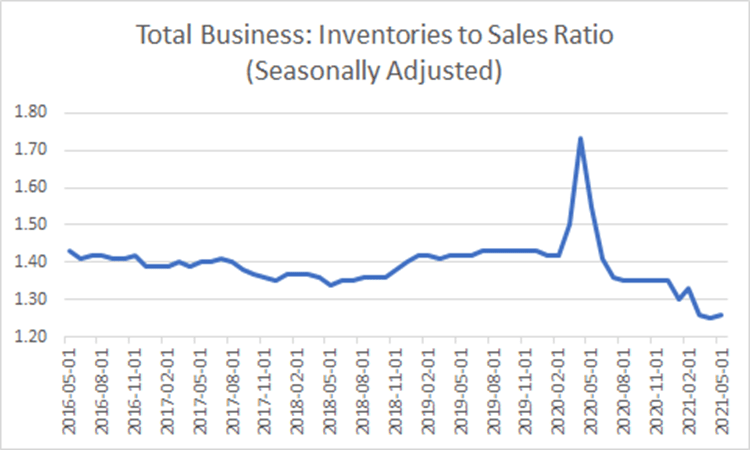
When consumption soars and producers are not in a position to supply the needed products, two things happen. The first thing is that they run down their inventories. That’s a key reason why investment fell. Firms sold off inventories, by around 1 percentage point of GDP.
Is that unusual? Why yes, it is. Here is a graph showing the ratio of inventories to sales.
As you can see, firms normally try to keep this ratio fairly steady. But when there is demand and not enough supply, they need to let their inventories go. That is exactly what has been happening.
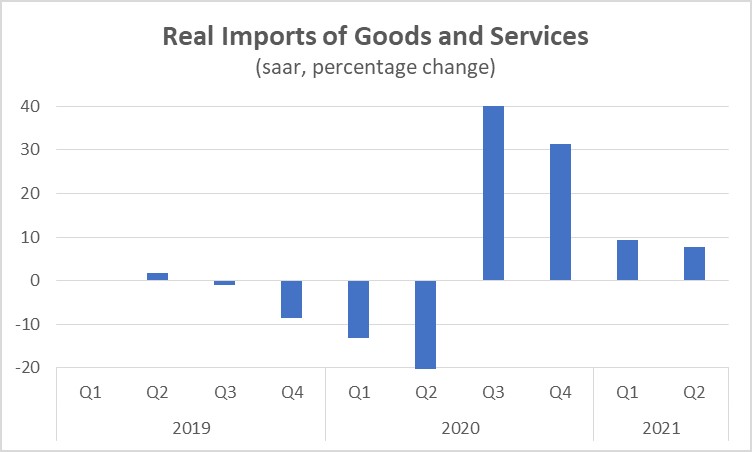
The second thing that firms do when there is demand which domestic producers are unable to meet is that they turn to foreign suppliers. In the chart below, I’ve cut off the two extremes — the deep plunge in the second quarter of 2020 and the big rebound in the third quarter – so that you can see the more recent data more clearly. A quick glance shows that imports are growing very rapidly, by more than 9 percent in the first quarter and nearly 8 percent in the second. And the numbers would be even higher, except that foreign producers are facing constraints of their own.
How do we know that foreign suppliers are having problems meeting demand? One way to find out is to run down to the Container Store, which relies almost exclusively on foreign products, and ask employees why their shelves are so empty. In no time at all, you will get a clear picture of the enormity of the problem.
But of course this is just anecdotal data. Most people prefer statistics. So take a look at the Manufacturing PMIs. Each month, Markit asks firms all over the world whether Suppliers’ Delivery Times are improving or deteriorating. A number over 50 indicates that more than half of firms are reporting that delivery times are improving. Unfortunately, for the past few months the numbers for the Emerging Markets that supply much of the world’s consumer goods are running around 45-46. So, things don’t seem to be improving; to the contrary, the supply constraints seem to be getting worse.
What about the US? I was afraid you’d ask. The graph is so shocking that I don’t even want to put it into words.
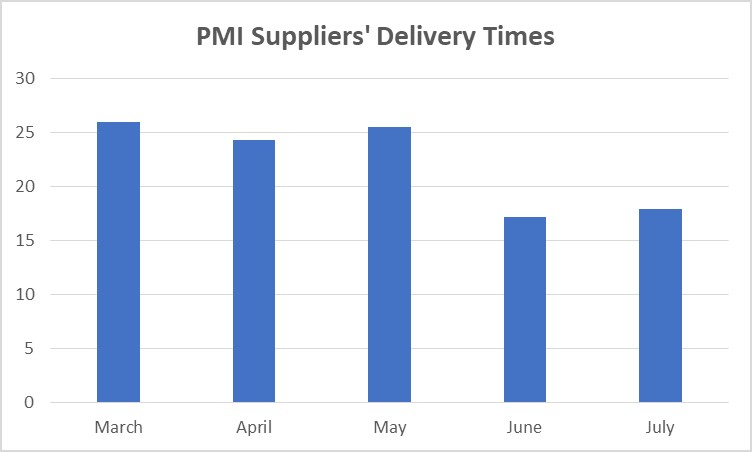
Yes, you read those numbers correctly. The situation is a disaster and it is only getting worse.
Summing up, what we learned from the GDP report – or to be more accurate, what we saw confirmed in the numbers – is that the US economy is really struggling to increase supply to meet resurgent demand. There are only three ways this story can end:
- The best option: supply could quickly gear up, closing the gap with demand.
- The disappointing option: demand could subside and growth could collapse.
- The worst option: the demand/supply mismatch could persist, in which case growth will slide back while inflation will persist.
The Administration is hoping for the first scenario. The Fed is worried about the second one. Meanwhile, the third secenario is keeping some economists up at night. We shall see who is right.
Put on your seat belts. It could be a rough ride.
